Fisheye Perspective Demos

Originally I scrolled through videos on Bilibili. I found a controversial topic about how to correctly draw a fish-eye perspective picture. Some claim that grid lines are distorted to perfect circles, while others believe ellipses are the correct way to draw it. From what I’ve seen, most artists believe drawing circles is the answer or only teach it. It makes sense since drawing a circle on the paper is way easier than an ellipse.1
Although I can’t draw, and I haven’t entered the field of computer graphics, I wrote a script to illustrate what do different fisheye cameras see.
I spent quite a lot of time on this Python code.
# /// script
# requires-python = ">=3.12"
# dependencies = [
#     "numpy>=2.4.2",
#     "pillow>=12.1.0",
# ]
# ///
from PIL import Image, ImageDraw
import math
import numpy as np

class ProjectionRenderer:

    PROJECTIONS = [
        lambda theta: theta,
        lambda theta: 2 * math.sin(theta / 2),
        lambda theta: math.tan(theta), # vanilla
        lambda theta: math.sin(theta), # ellipse
        lambda theta: 2 * math.tan(theta / 2), # circle
    ]

    def __init__(self, proj_mode=3, unit_num=1.1, side_len=1023, rotation=0):
        assert(side_len%2==1)
        self.side_len = side_len
        self.radius_px = (side_len-1)//2

        # camera is at (0,0,0), facing positive z
        self.proj_mode = proj_mode
        self.px_per_unit = int(self.radius_px / unit_num)
        self.unit_num = unit_num
        self.rotation = rotation

        self.dist = 1.0 # grid is on plane (*,*,dist)
        self.grid_size = 0.2
        self.inf = 1e3
        self.eps = 1e-1
        self.cnt = 15

    @staticmethod
    def spherical_coords(x, y, z):
        # theta: angle between positive z-axis
        # phi: argument in x-y plane
        theta = math.acos(z / math.hypot(x, y, z))
        phi = math.atan2(y, x)
        return theta, phi

    def project_coord(self, theta, phi):
        r = self.PROJECTIONS[self.proj_mode](theta)
        return r * math.cos(phi), r * math.sin(phi)

    def to_pixel_coords(self, *coords):
        pixel_coords = []
        for coord in coords:
            pixel = self.radius_px + 0.5 + coord * self.px_per_unit
            pixel_coords.append(pixel)
        return pixel_coords

    def rotate(self, point): # around y-axis
        x,y,z = point
        sin,cos = math.sin(self.rotation), math.cos(self.rotation)
        x,z = x*cos-z*sin, x*sin+z*cos
        return x,y,z

    def draw_grid_line(self, draw, points_3d, color="white"):
        points_3d = list(point for point in map(self.rotate, points_3d) if point[2] > 0 or True)
        projected_points = []
        for point in points_3d:
            theta, phi = self.spherical_coords(*point)
            x_2d, y_2d = self.project_coord(theta, phi)
            projected_points.extend([x_2d, y_2d])

        draw.line(self.to_pixel_coords(*projected_points), width=0, fill=color)

    def render(self, show=False):
        img = Image.new("RGB", (self.side_len, self.side_len), "black")
        draw = ImageDraw.ImageDraw(img, mode="RGBA")

        # horizontal grid lines
        x_samples = np.arange(-self.inf, self.inf, self.eps)
        for i in range(-self.cnt, self.cnt + 1):
            color = "magenta" if i == 0 else "white"
            points = [(x, i * self.grid_size, self.dist) for x in x_samples]
            self.draw_grid_line(draw, points, color=color)

        if self.proj_mode == 4:
            x_samples = np.arange(-self.inf, self.inf, self.eps*0.1)
            for i in range(-self.cnt, self.cnt + 1):
                color = "magenta" if i == 0 else "white"
                points = [(x, -i * self.grid_size, -self.dist) for x in x_samples]
                self.draw_grid_line(draw, points, color=color)

        # vertical grid lines
        y_samples = np.arange(-self.inf, self.inf, self.eps)
        for i in range(-self.cnt, self.cnt + 1):
            color = "blue" if i == 0 else "white"
            points = [(i * self.grid_size, y, self.dist) for y in y_samples]
            self.draw_grid_line(draw, points, color=color)

        if self.proj_mode == 4:
            y_samples = np.arange(-self.inf, self.inf, self.eps)
            for i in range(-self.cnt, self.cnt + 1):
                color = "blue" if i == 0 else "white"
                points = [(-i * self.grid_size, y, -self.dist) for y in y_samples]
                self.draw_grid_line(draw, points, color=color)

        # reference of 180° FOV
        max_radius = self.project_coord(math.pi / 2, 0)[0]
        draw.ellipse(
            self.to_pixel_coords(-max_radius, -max_radius, max_radius, max_radius),
            width=1,
            outline=(255, 0, 0, 255)
        )

        if self.proj_mode == 3 and self.rotation == 0:
            # reference ellipse
            short_axis = self.project_coord(*self.spherical_coords(0, self.grid_size*2, self.dist))[1]
            draw.ellipse(
                self.to_pixel_coords(-1, -short_axis, 1, short_axis),
                width=2,
                outline=(0, 255, 0, 127)
            )

        if self.proj_mode == 4 and self.rotation == 0:
            # reference circle
            k=self.project_coord(*self.spherical_coords(0, self.grid_size*6, self.dist))[1]/2
            t = (k**2+1)/2/k
            draw.ellipse(
                self.to_pixel_coords(-2*t, -2/k, 2*t, 2*k),
                width=2,
                outline=(0, 255, 0, 127)
            )

        # flip the image to match the direction of y-axis
        img = img.transpose(Image.FLIP_TOP_BOTTOM)

        if show:
            img.show()

        return img

if __name__ == "__main__":

    renderer = ProjectionRenderer()

    # NOTICE: some configs require manual adjustment
    for sl,name in [
        # (511,"low"),
        # (2047,"high"),
        # (511,"low_rot90"),
        # (2047,"high_rot90"),
        (511,"low_rot45"),
        (2047,"high_rot45"),
        ]:

        print(sl,name)

        if len(name)>4:
            rota = int(name[-2:]) / 180 * math.pi
        else:
            rota = 0

        # if name[:3]=="low":

        #     renderer.__init__(0,math.pi/2*1.05,sl,rota)
        #     renderer.render().save(f"img/0_{name}.png")

        #     renderer.__init__(1,2**0.5*1.05,sl,rota)
        #     renderer.render().save(f"img/1_{name}.png")

        #     renderer.__init__(2,3*1.35,sl,rota)
        #     renderer.render().save(f"img/2_{name}.png")

        # renderer.__init__(3,1*1.05,sl,rota)
        # renderer.render().save(f"img/3_{name}.png")

        renderer.__init__(4,6,sl,rota)
        renderer.render().save(f"img/4_{name}.png")
Here are the results. Have fun with these figures!
Following pictures all show the perspectives of the same point. The camera is placed at origin with orientation matched z-positive (y-axis is the vertical axis while x,z are horizontal). The white-coloured grid is composed of squares with 0.2-unit sides, located on the plane (*,*,1).
The red circle represent 180°2 FOV boundaries. The grid line (*,0,1) is coloured magenta and (0,*,1) is coloured blue.
Figure A
Below, \(\theta\) is the angle from central axis of view to the line connecting view point and the small object; \(r\) is the distance from screen centre to the image of the object.
- \(r=\theta\). 180° FOV circle has radius of \(\pi/2\).
- \(r=2\sin(\frac\theta2)\). 180° FOV circle has radius of \(\sqrt 2\).
- \(r=\tan(\theta)\). The simplest perspective projection. Straightness of lines is preserved.
- \(r=\sin(\theta)\). The “ellipse” mode. 180° FOV circle has radius of \(1\).
- \(r=2\tan(\frac\theta2)\). The “circle” mode. 180° FOV circle has radius of \(2\).
The proof isn’t hard, but I still drew a green ellipse on Pic 3 and a perfect circle on Pic 4 in Figure A just to make it look more convincing.
Notice: I additionally draw (*,*,-1) grid on Pic 4. The green circle consists of two parts:
- The upper “\(\frown\)” portion formed by (*,1.2,1)
- The lower “U” portion formed by (*,-1.2,-1)
Rendering light from back is disabled in Figure B and Figure C, except Pic 4.
This is what would happen after applying a rotation by 45° counterclockwise around the y-axis on the grid.
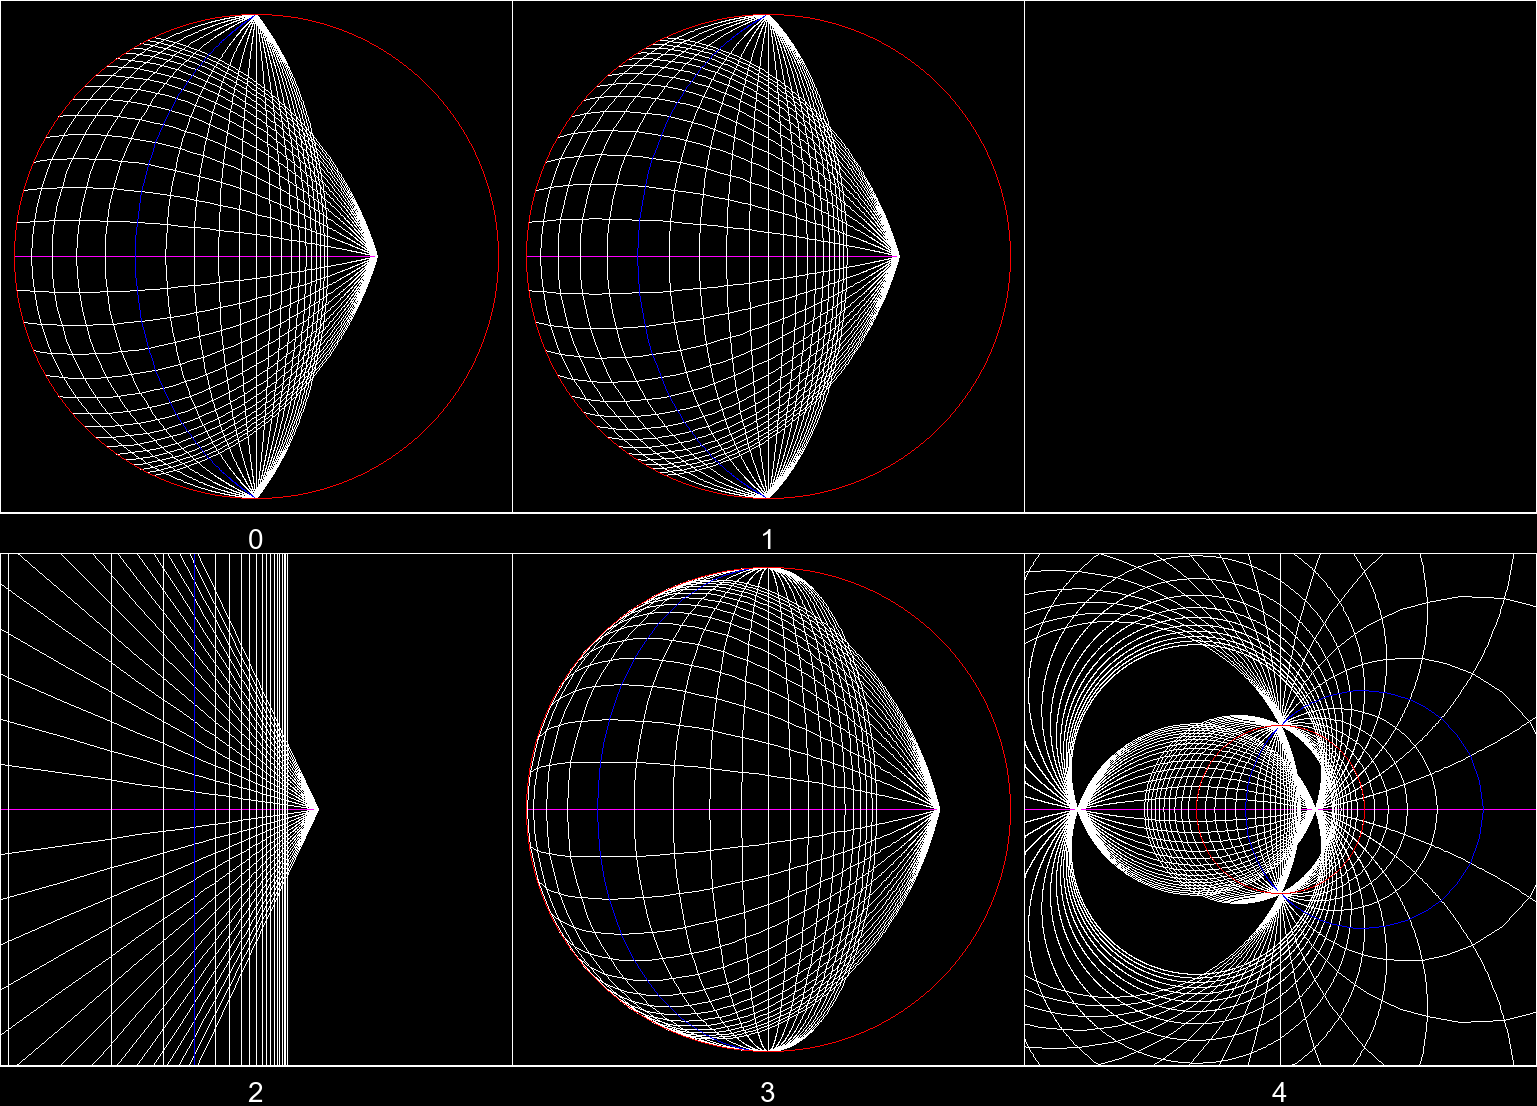
Figure B
And this is 90° counterclockwise.
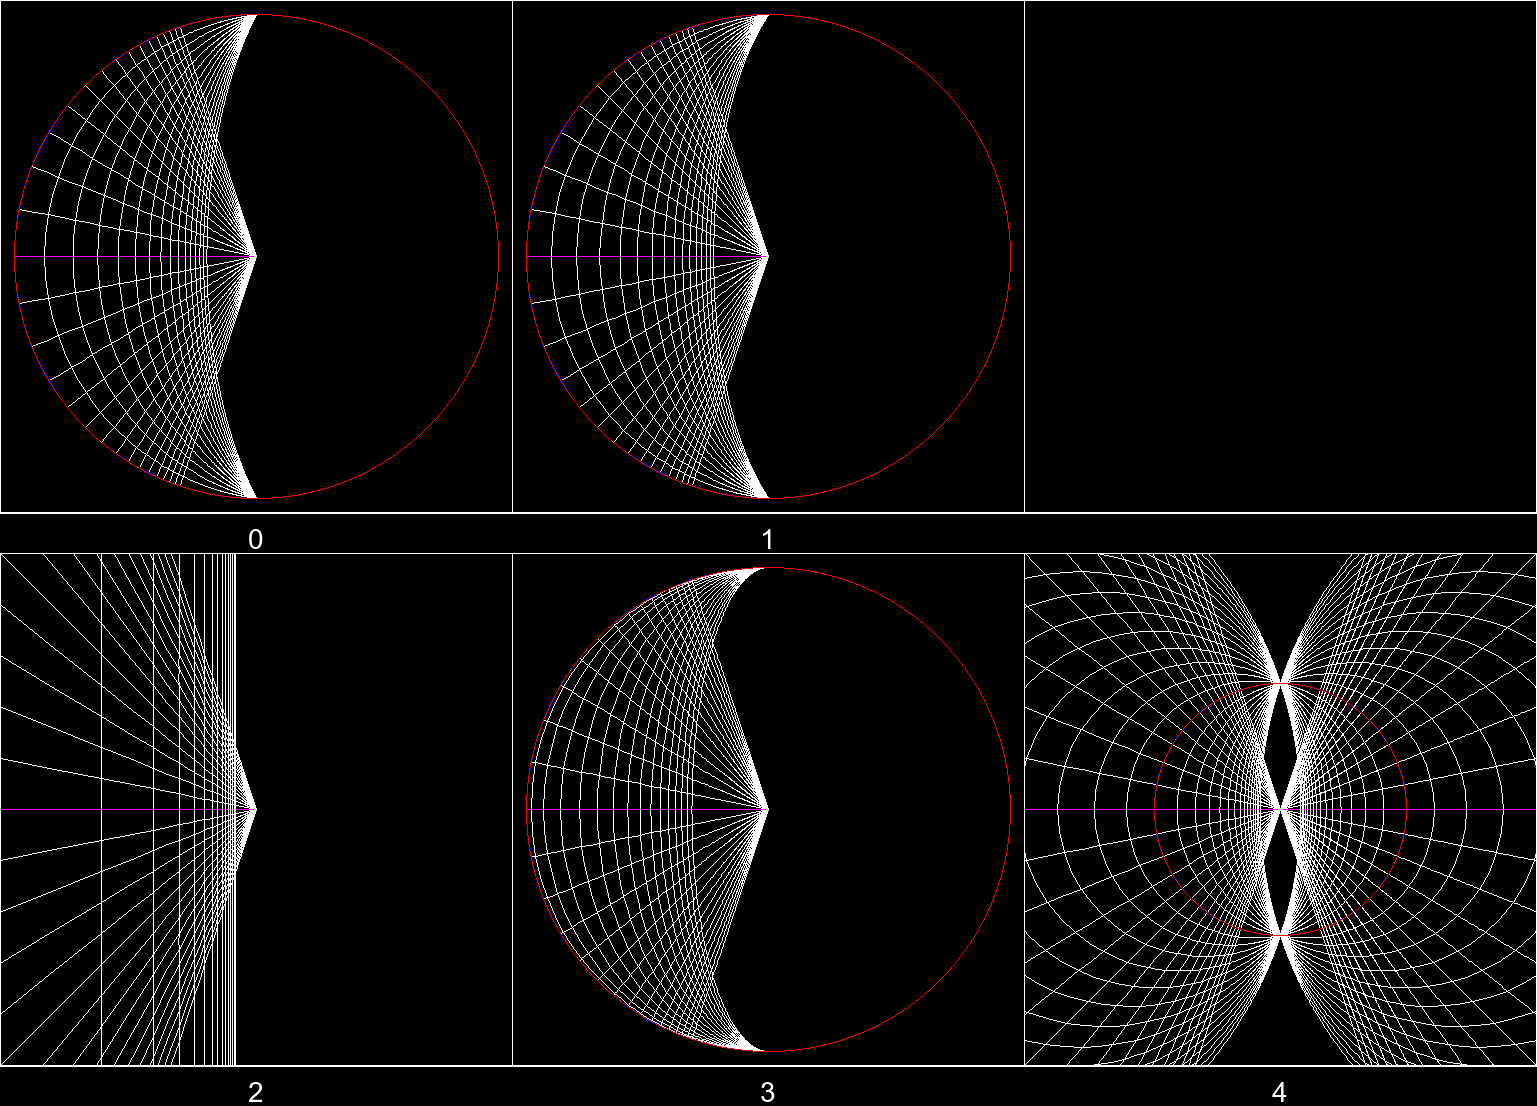
Figure C
Here are hi-res pictures of indices 3 and 4 in Figure A, B, and C: hi-res.png (6145x4178)
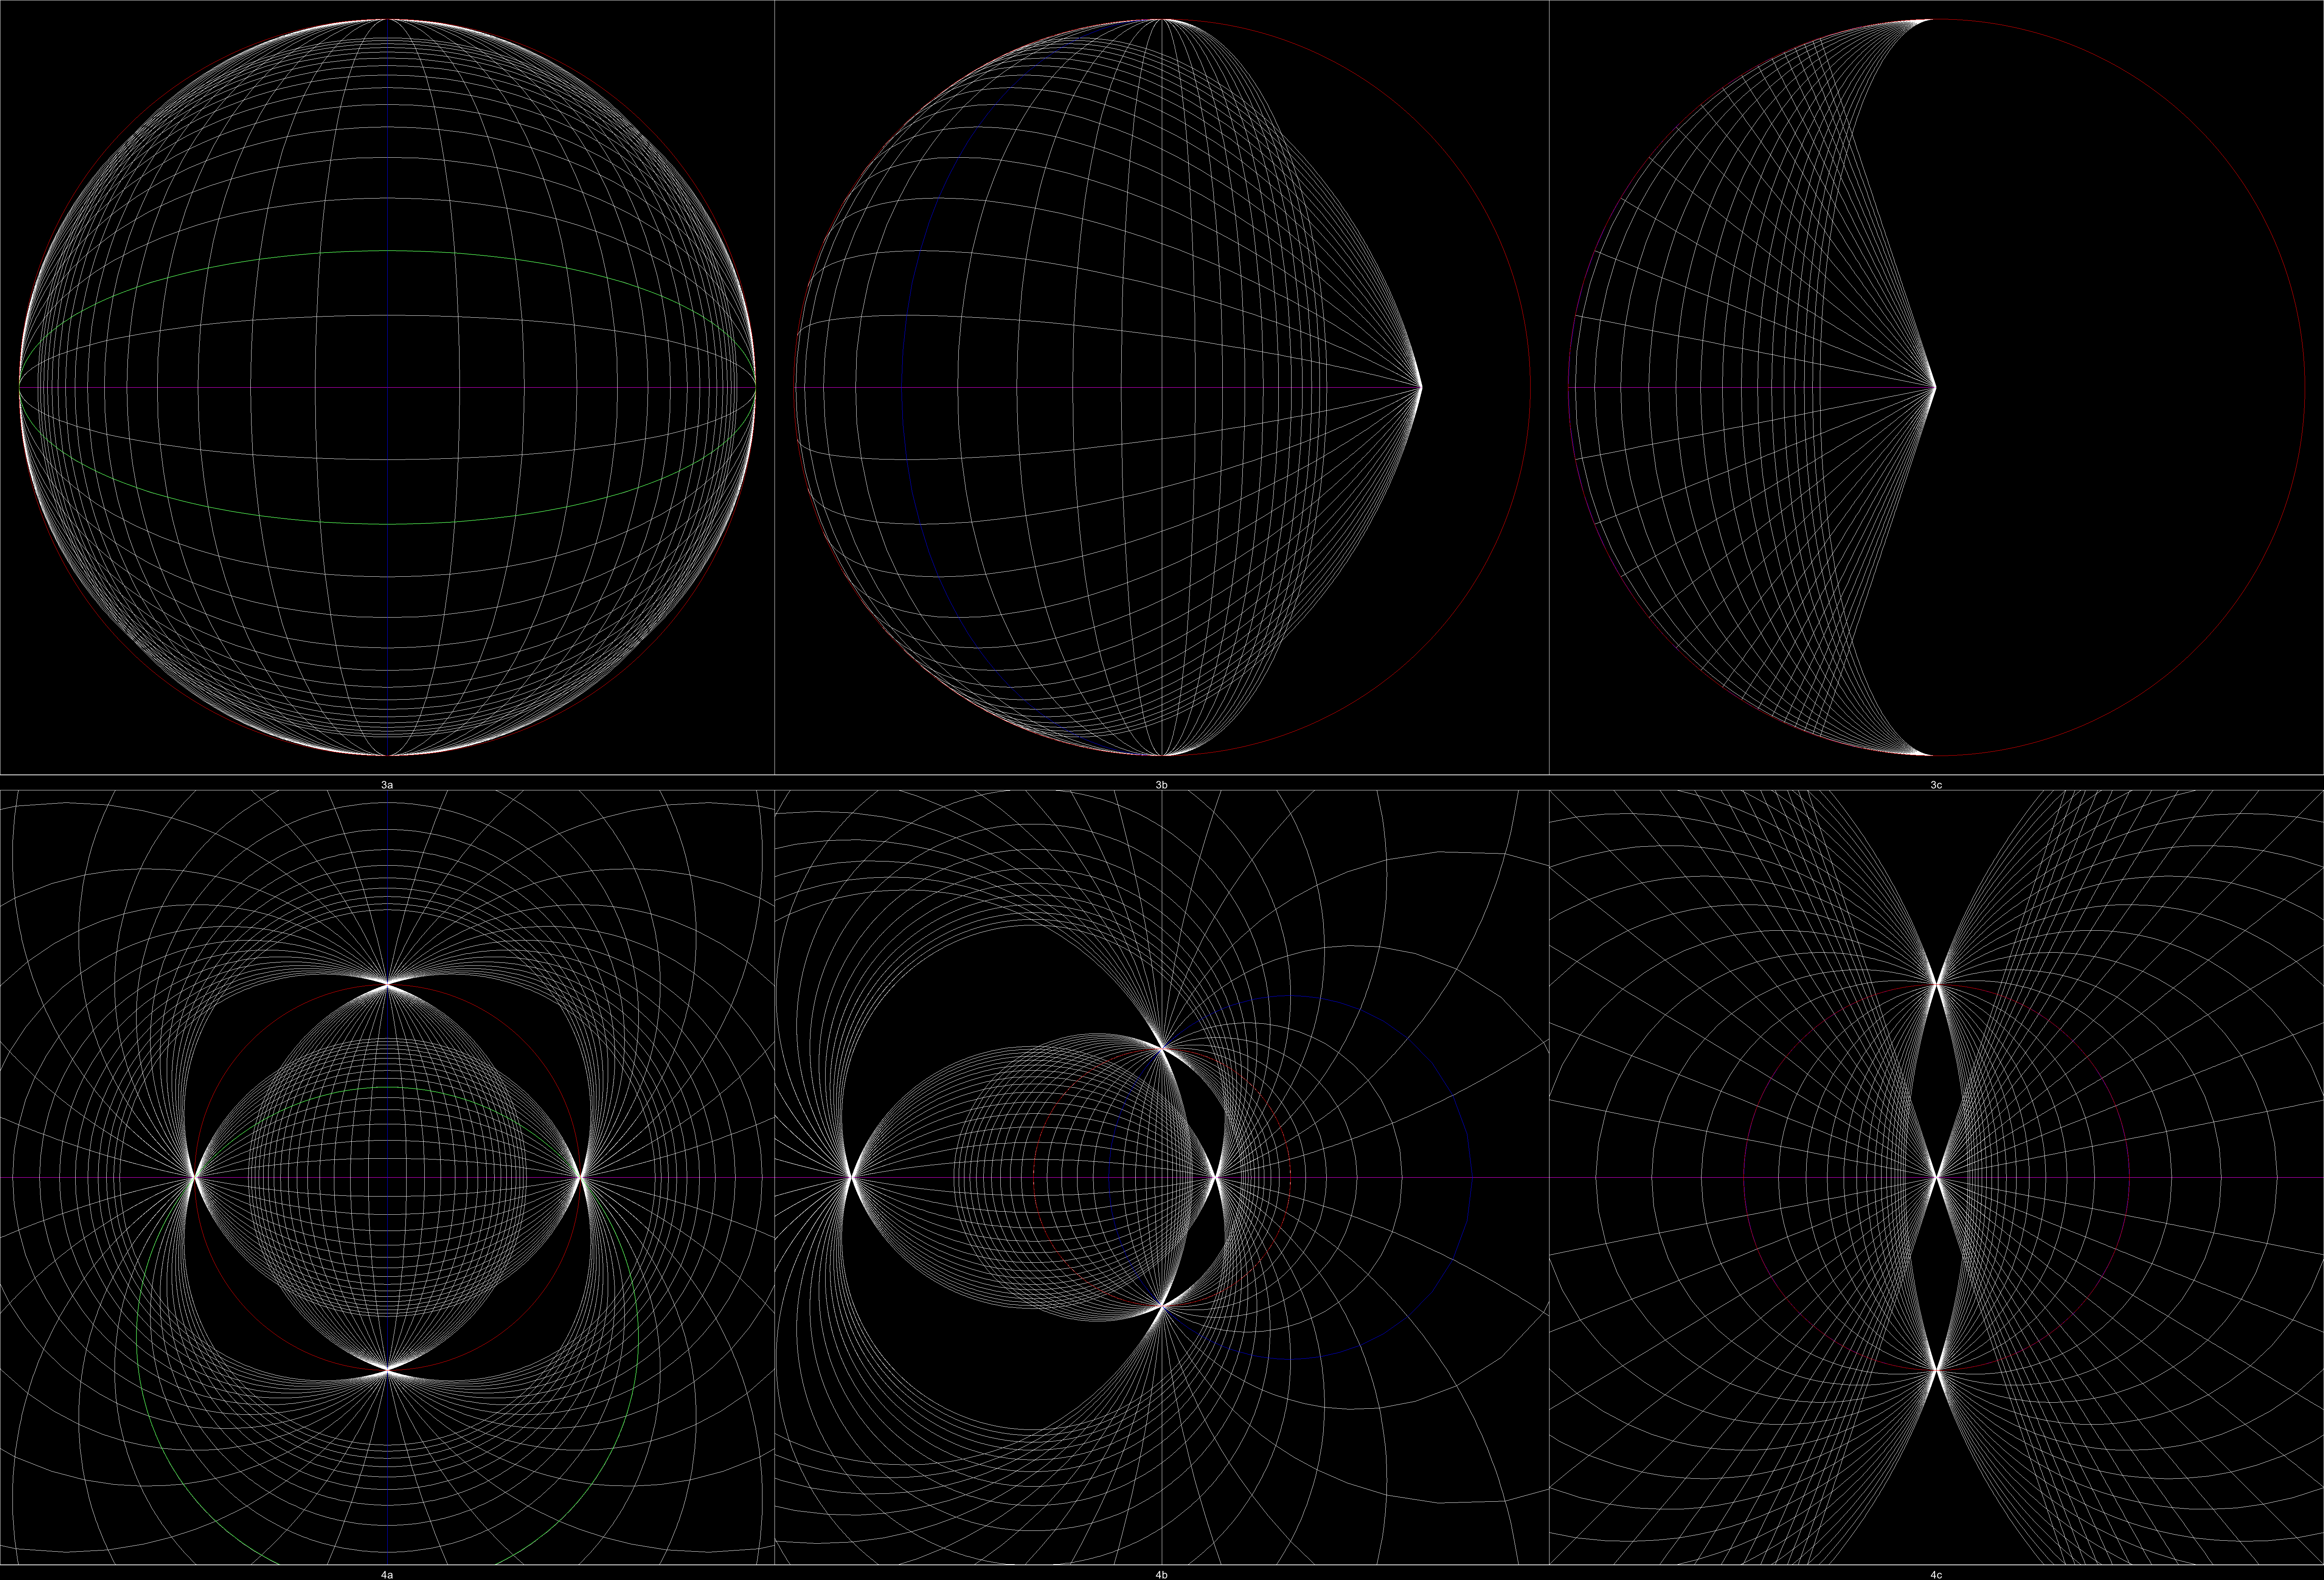
Next, we’ll discuss some sketching and drawing techniques in the “circle” mode (index 4).
You may find out two vanishing points (VPs) on the magenta line in Pic 4, Figure B. They have such geometrical relation with the FOV circle: [ VP1 - Top point on the FOV circle - VP2 ] is a right angle. It shows VP1 and VP2 are somehow “antipodal” on the magenta line. Actually it is. If we arrange horizontal VPs on a circle by their angles of view, then what we’ve just done is the stereographic projection. Because two VPs are antipodal, the angle at the circumference is 180°/2=90°.
This method is not limited to horizontal lines. You can always determine the two VPs of any direction in 3D on the screen.
How to draw a line given the direction and a point on it: find the two VPs first, then draw the circle passing through the two VPs and the point.
By lines of specific direction, you can constrain lengths in different axes to be proportional. You can scale a segment by any factor in the same direction by simply constrain back.
If you happen to understand Chinese, here is a video covering a part of sketching tips (but slightly differ from what I say).
So far, we can draw almost anything precisely from this perspective. The only thing we don’t know and never know is the real size of the objects on the screen.